I'm Building Taskito

Hough Transform
Let’s say you take a snapshot of a window. You used Canny/Soble edge detector and found a nice boundary of the window and you want to figure out representation of the window’s edge, size, etc. How would you do it? Right now it’s just some 200 odd pixels in near vicinity and representing the shape of a line.
You can iterate over all the pixels of that edge and find slope and intercept. Again, one more question arises. What if the line/curve is not continuous? There might be some distortion or noise present in the image.
To deal with all this we have Hough Transform.
What is Hough Transform?
Hough Transform is a feature extraction technique to find imperfect instances of object withing a certain class of shapes, i.e. lines, circles, ellipses, etc. The Hough transform was invented by Richard Duda and Peter Hart in 1972, who called it a “generalized Hough transform”.
Why Hough Transform?
You want some algorithm which gives more weight to the co-linear points and try to ignore arbitrary noise. Hough Transform works in a similar manner. It lets each pixel in the image vote. And the properties of the transform figures out prominent features in the image.
How does Hough Transform work?
A line is a set of points and a set is difficult to handle than a single point. The Standard Hough Transform maps each of edge pixels to many points in Hough (or parameter) space representing all possible lines that could pass through that point.
What is Hough Space?
Each line can be represented by two parameters.
- Slope of the line (m).
- Y-intercept of the line(c).
So to manage every point lying on a particular line, you just need two parameter. m and c. So the parameter space m-c was used. This parameter space is your Hough Space.
Representation of a point in Hough Space
Consider a point which lies on an edge in the image. Let that point be ( x1 , y1 ) in xy plane. This point would represent something in mc plane. Infinite lines can pass through a point. So for every line passing throug that point, there would be a unique set of slope and intercept represnting the line in mc plane.
y1 = mx1 + c
c = -x1m + y1
So, a point in xy plane is equivalent to a line in mc space.
What do lines in Hough Space signify?
You have a edge detected image and for every white pixel you draw a line in mc plane. Now, some lines will intersect. These intersection points are the parameters of line which passes through those points. Each point represents as various lines in the mc space.
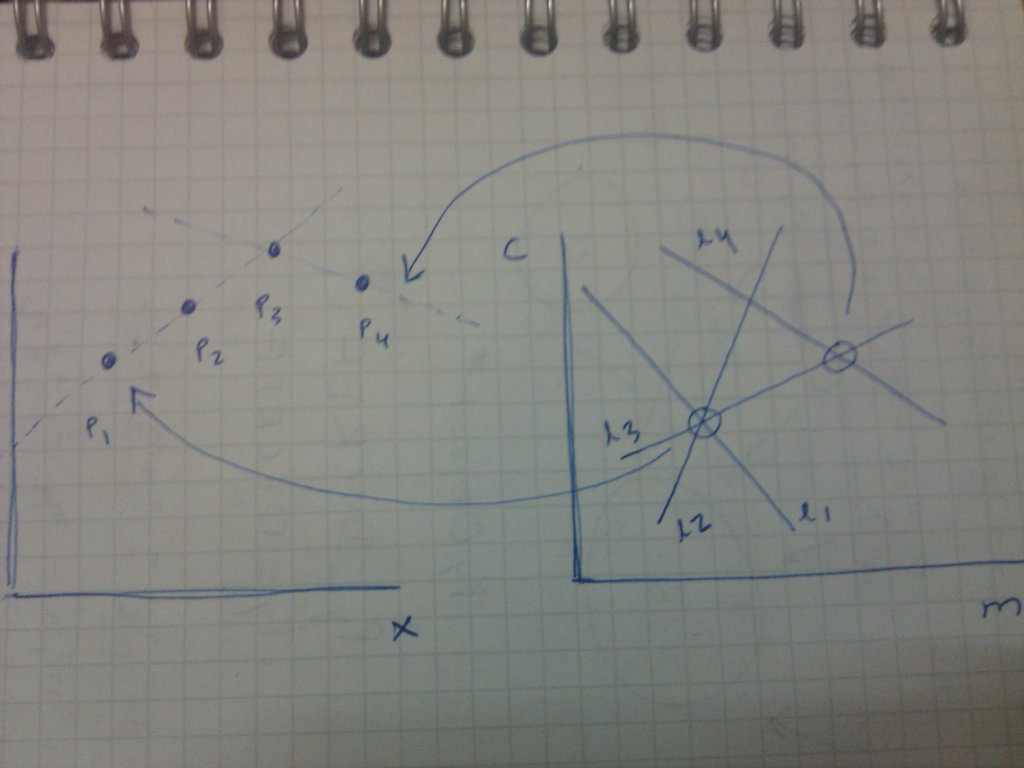
Now, if we observe each intersection point, then we can easily see that intersection point of line 1 and line 2 represents the slope and intercept of the line passing through point 1 and point 2. Similary, intersection point of line 3 and line 4 represents the slope and the intercept of the line passing through point 3 and point 4. The interesction point of line 1, line 2 and line 3 represents the slope and the intercept of the line passing through point 1, point 2 and point 3.
So we can see that the point which is the common interception of more number of lines will represent the slope and intercept of the line passing through more number of points. And similary, if a point has only one passing through line in mc space will represent a line which passes through only one edge point.
Detecting Lines
To detect lines in the image, you’d need to find lines which are best fit for greater than a limited number of points.
How to get a line which passes through a large number of points?
After converting each point in xy plane to a line mc plane, we would want to find which points represent strong lines. So the idea is to let each point vote.
So we create a 2D array for m and c represntation. This is array is called as accumulator. It has mxn number of bins each representing a particular (m, Θ) The horizontal axis represents slope and the vertical axis represents intercept of the line. For a point in xy plane, you create a line in mc plane. Now, you vary the value of m, and obtain different values of Θ. For each value of (m, Θ) you add a vote in the bin of (m, Θ). You do this for every line in your mc plane and at the end you’ll get something like this.
| Points | No. of Votes |
| (m11, c81) | 50 |
| (m29, c36) | 80 |
| (m30, c70) | 06 |
So this represents that line with slope (m11, c81) passes through 50 number of edge points. And similary, for other points.
So what’s the error here?
How do you decide the range from which m and c should vary? slope can vary from -90 to +90 but as slope comes around 90 (i.e. line is almost vertical), how would you decide the value of your intercept and how would you decide the length of the accumulator?
To avoid this, you need to come up with a different parameter where the parameters vary in a predefined range.
Polar coordinates
What is the polar representation of a line?
r = x1cos(Θ)+y1sin(Θ)
where Θ is the angle that normal from the origin to the line makes with the x-axis and r is the perpendicular distance of the line from the origin.
Range of parameters:
- Θ varies from -90 to +90.
- r varies from 0 to the diagonal length of the image.
With this new representation, we have a new transition from xy plane to Hough plane. A line in the xy space still represents a point in Hough space (pΘ plane here). But a point in xy space represents a sinusoid in r-Θ space.
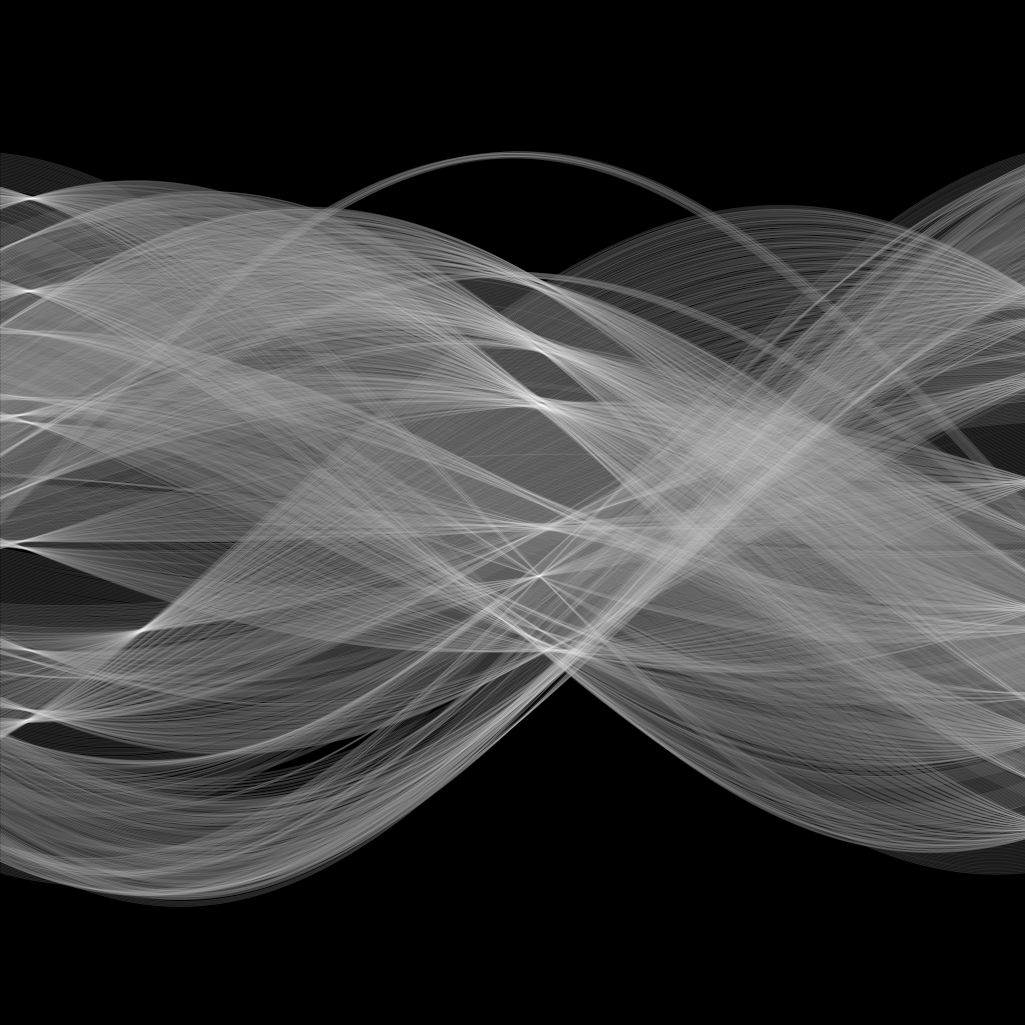
Sinusoid representation
Similar to line representation in mc space, a sinusoid in r-Θ space represents a point in xy space. So each point in xy space is converted to a sinusoid in r-Θ space. And we let each point in r-Θ space vote.
Implementation
A 2D accumulator is created which accumulates votes of each point represented by each cell of the accumulator.
You choose a sinusoidal and vary Θ to get different r. You take the value of Θ and obtain corresponding value of r and cast a vote in the particular (Θ, r) accumulator cell. By voting, you increase the value of the cell by 1. After voting, you choose another value of Θ and vote in corresonding accumulator cell by Θ and r. Continue doing this from Θ=-90 to Θ=+90. And for every such calculation, you add vote in the accumulator.
You perform this for every sinusoidal in r-Θ space.
Detecting Lines
Similar to mc plane, each (Θ, r) point will have some number of votes and depending on the number of votes, we will obtain the line which will be the best fit for a certain set of points.
| Points | No. of Votes |
| (Θ51, r83) | 100 |
| (Θ29, r46) | 80 |
| (Θ30, r70) | 60 |
(Θ51, r83) gives a line which passes through 100 edge poitns in the image. So it means that a lot of points voted for that spot.
Now, depending on a threshold you can select which line to draw. Let’s suppose you keep threshold as 75. So each value of (Θ, r) which got less than 75 votes will be discounted and only the sets which got more than 75 votes will be counted as lines.
Accuracy
The accuracy will depend on the number of accumulator cells (directly related to number of Θs you take). So more the number of Θ values better the accuracy of the Hough transform.
The accuracy also depends on the thresholding value. If you keep low threshold, you’d get some lines which pass through very less number of point. So you’ll get more number of lines but innacurate. If you keep very high threshold, you’d get lines which pass through large number of points. This line will be very accurate but you’d get less number of lines.
Extension
This hough transform can be extended to find any type of curves and shapes in the image. To find a circle in an image, you’d get parametric equation of the circle. Represent each point as a circle in hough space, get accumulator, vote and choose. I’ll explain Hough Circles in details and how this can be extended to detect other curves in upcoming posts.
P.S. First blogpost with jekyll and markdown.
Playing around with Android UI
Articles focusing on Android UI - playing around with ViewPagers, CoordinatorLayout, meaningful motions and animations, implementing difficult customized views, etc.